This is Part One of a three part series based on a rare earth elements (REE) review which is available for download at slideshare, where references can be viewed. Part 1 is an introduction to REEs. Part 2 analyzes REE consumption and refining and Part 3 looks at how REEs might affect the green economy.
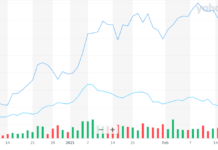
Rare earths captured the popular imagination a year or two ago. Since then a bonfire of reports, presentations and analyses have been published, with many generating more consulting fees than light [1-45]. Figure 1 shows the uptrend in google entries for “rare earth elements”, and obviously if it doesn’t exist on google, it is irrelevant.
Figure 1: Google results for “rare earth elements”

The rare earth story is compelling. By near unanimous consent, the narrative is that REEs are “essential” [38], “indispensible” [30], or “crucial” [37] to every aspect of the green economy from wind turbines to electric vehicles to energy efficient lighting. Further spice is added by those who see REEs as the “New Great Game” [2]. Many military components require REEs from the M1A2 Abrams tank’s samarium cobalt magnet for navigation to the DDG-51 Hybrid Electric Drive Ship Program’s reliance on neodymium magnets for electric assist propulsion [10]. And China controls the supply. This leads to much hand-wringing, some based on mercantilist sentiment, others geo-strategic, and yet more on envy of China’s autocratic regime.
Figure 2: Top 6 Rare Earth Elements [46] Figure 3: Game Over for Whom? [47]


2. Rare Earth Backrgound
A proviso is required for any figures shown here. Rare earth statistics are always “estimated”, the data is sketchy (not least because some comes from China), and so most data comes with a +-15% band. Figure 4 shows the regions where supply currently comes from [31, 33].
Figure 4: Currently Producing Regions of the World (i.e. Not America)

Figure 5 shows a picture from Google Earth of the mine at Baiyun-Obo [9]. The surrounding area has become poisoned, as the ever reliable Daily Mail reports [5]:
“I was the first Western journalist to set foot inside the mine….. the new-found wealth has come at an appalling environmental price, turning the town and the surrounding areas into a poisoned, arid wasteland littered with unregulated refineries where the rare-earths are extracted from rocks…The land is scarred with toxic runoffs from the refining process and pock-marked with craters and trenches left by the huge trucks that transport the rocks across ice and mud. Rusting machinery lies scattered along the valley floor, giving it the appearance of a war zone.”
China has used this environmental damage as a pretext for stricter export quotas. Production quotas for environmental reasons might be entertained by the WTO, however export quotas are not. In previous years, as a result of the cheaper costs of Chinese REE production, and due to China flooding the market, other REE operators shut down. This is shown in Figure 6 (two data sets were fused: 1986-2002 from [11] and 2002-2009 from [44]).
Figure 7 shows Chinese production along with the declining export quotas. A figure for 2010 expected demand from the west is also shown [39, 42]. It is important to stress that the Chinese export quota is just for the upstream metals. Downstream, processed materials such as Neodymium-Iron-Boron magnets can still be exported. This is part of an effort to encourage foreign manufacturers to locate in China. As Figure 7 shows, however, this year there may be a shortfall in demand for raw REEs in the West. This will be met, at least in part, by drawing down stockpiles [12]. Additionally, some enterprising Chinese may smuggle some out of the country.
Figure 5: Baiyun-Obo, the Black Heart of the Green Economy?
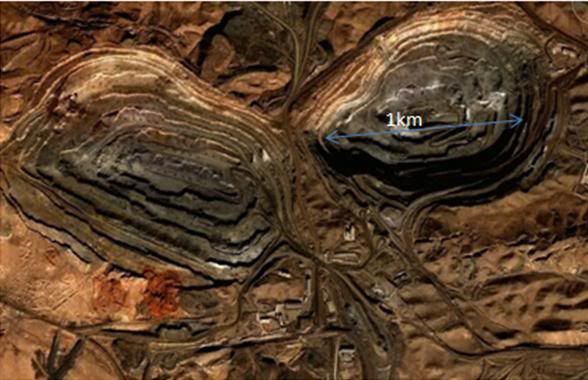
Figure 6: Global REE Production 1986-2009

Figure 7: Rest of World Demand for RE Salts, Oxides & Metals

Continued in Part II.. References are available here.


