John Petersen
Last Wednesday I stirred up a hornets nest with an article titled “A Reality Check for Wind Power Investors” that included two graphs from the Bonneville Power Administration, or BPA, which manages a four state, 300,000 square mile service region that’s home to over 40% of the installed hydro capacity and roughly 12% of the installed wind capacity in the US.
The first graph tracks the BPA’s regional load and power production from hydro, thermal and wind facilities over the last seven days and shows why the region is one of the largest power exporters in the country.

The second graph provides stand-alone tracking data for wind power in the BPA region over the last seven days.

My concern was that the BPA graphs clearly contradict widely accepted notions that:
- Wind turbines will generate on average 30% of their rated capacity;
- The wind is always blowing somewhere and geographic dispersion will eliminate instabilities;
- Periods of widespread low wind are infrequent; and
- The probability of very low wind output coinciding with peak electricity demand is slight.
Until I saw the BPA graphs I assumed that wide geographic dispersion of facilities would ameliorate the erratic nature of wind power. The graphs proved my assumption wrong. Once it became clear that broad regional dispersal wasn’t enough, I began looking for comparable data on a nationwide basis and couldn’t find it – ANYWHERE.
Yesterday, Jack Lifton pointed me in the direction of a March 2011 “Analysis of UK Wind Power Generation” that was commissioned by the John Muir Trust, Britain’s premier wildlands conservation charity, and found that:
- Average output from wind in the UK was 27.18% of capacity in 2009, 21.14% in 2010, and 24.08% between November 2008 and December 2010 inclusive.
- There were 124 occasions from November 2008 through December 2010 when total generation from the windfarms metered by National Grid was less than 20 MW from an average capacity of over 1,600 MW.
- The average frequency and duration of a low wind event of 20 MW or less between November 2008 and December 2010 was once every 6.38 days for a period of 4.93 hours.
- At each of the four highest peak demands of 2010 wind output was low being respectively 4.72%, 5.51%, 2.59% and 2.51% of capacity at peak demand.
The study’s most startling conclusions were that:
- The nature of wind output has been obscured by reliance on “average output” figures. Analysis of hard data from National Grid shows that wind behaves in a quite different manner from that suggested by the study of average output … or from wind speed records which in themselves are averaged.
- It is clear from this analysis that wind cannot be relied upon to provide any significant level of generation at any defined time in the future. There is an urgent need to re-evaluate the implications of reliance on wind for any significant proportion of our energy requirement.
While the complete set of 28 monthly tracking graphs that accompany the UK Analysis are less colorful than the BPA’s, the erratic and wholly unreliable character of the UK’s wind resource is remarkably similar to the BPA’s resource.
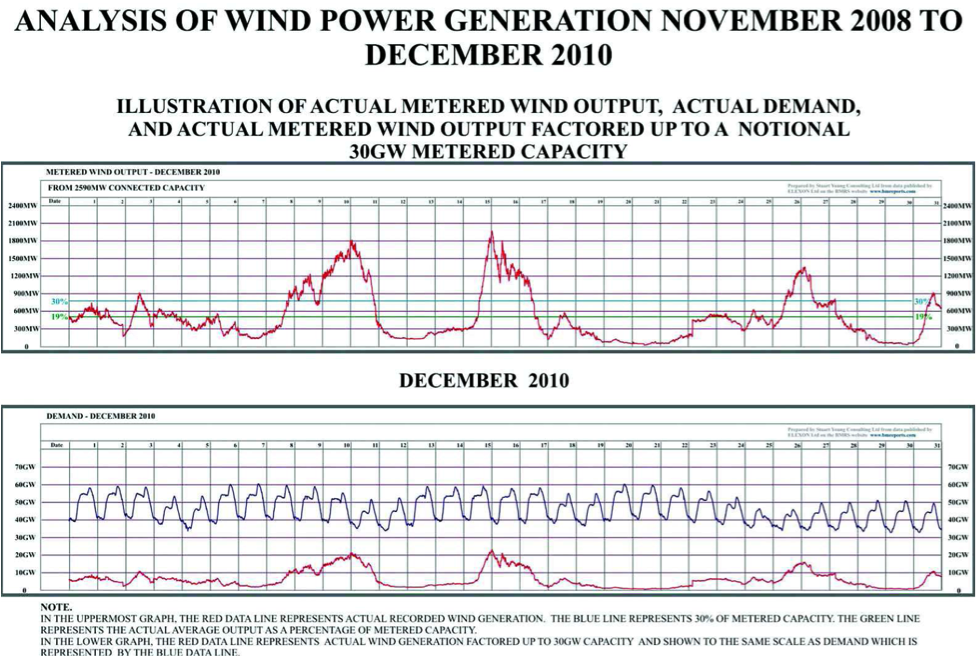
My undergraduate degree was in accounting and I understand statistics well enough to know that data from a single region does not disprove the theory that geographic dispersion of wind facilities will solve the intermittency problem. However, my accounting professors taught me that when two substantial samples from regions as diverse as the UK and the Pacific Northwest leave room for reasonable doubt, prudence requires a larger sample and a more granular analysis.
The idea of geographic dispersion is so inherently plausible that it’s accepted without question. What if it’s a lie? We know it doesn’t hold water in the BPA region and we know it doesn’t hold water in the UK. The raw data almost certainly exists. Compiling the hard data into a national landscape would require little more than an Excel spreadsheet, particularly if we assume away the need for a robust and flexible interstate transportation grid. The only reason I can imagine why nobody has published results from such a study is that the results are dreadful and they disprove the theory.
I would love to be proven wrong on this point because my preliminary conclusions are damned inconvenient. The time for platitudes and calm assurances from advocates and promoters is past. We need detailed analysis of hard day to day data if we ever hope to have a sensible energy policy that works in the real world.
In light of the clear data from the BPA and confirmation from comparable analysis in the UK, I continue to believe that investments like the First Trust ISE Global Wind Energy Index ETF (FAN), the PowerShares Global Wind Energy Portfolio ETF (PWND) and a host of publicly traded wind power stocks should be avoided like the plague.
Disclosure: None.






The data for wind farm performance is hard to find, but there are people working on it. I wrote about one study two years ago:
http://www.altenergystocks.com/archives/2009/04/our_undiversified_wind_portfolio_1.html
Part of the problem with BPA is that the location of wind farms is chosen to maximize energy output, not to maximize diversification. This is like putting together a stock portfolio purely on the basis of yield- not a good idea. See the article above.
In order to maximize the benefits of geographic diversification, your grid needs to be larger in scale than the weather patterns that drive wind and sun.
A look at a national weather map usually shows only around 2-4 different high and low pressure regions in the entire US, so in order to achieve good wind diversification, we’d need a grid that covers at least half the country. The UK is probably not big enough to achieve good diversification without links to the mainland (which is exactly the intent with the planned North Sea Supergrid.
http://www.offshore247.com/news/art.aspx?Id=18313
Given the variability of the hard data I am unwilling to assume that integration across multiple regions will do the trick without seeing a compilation and overlay of the hard data from those regions and a plan that lays out how the interconnections will work.
It’s one thing to say that interconnections and robust transmission could solve everything and another entirely to have interconnections and robust transmission. If we go putting the cart before the horse we’ll end up with a dozen balkanized regions instead of a functional integrated whole.
In line with what Tom is saying, the bulk of the wind power capacity in BPA’s region is concentrated along the Columbia River (within about 20 miles north or south of the river, and mostly in a stretch beginning a little east of The Dalles, OR and continuing for 40 miles or so). It doesn’t make a good test of the geographic diversity argument.
Check out BPA’s map here: http://transmission.bpa.gov/PlanProj/Wind/documents/BPA_wind_map_2010.pdf
Even if it was widely dispersed it would not be enough to disprove the geographic diversity theory. However, when there are two data sets and they both show wind to be woefully inadequate I believe the burden of proof shifts to the advocates for the geographic diversity theory.
I’m happy to accept the facts, but I’m no longer willing to accept a theory that isn’t supported by detailed factual analysis.
You might want to do some research behind the “consulting” company that was used by JMT. Stuart Young is a notorious anti-wind crank.
Here’s his so-called visualization company:
http://www.syvisuals.co.uk/
The last image gives you an idea of this person’s approach to objectivity.
If you want real science with regards to wind energy and its integration into grid systems, may I suggest you look at the Fraunhofer Institute for Wind Energy and Energy System Technology. Here’s a link to their past decade of work:
http://www.iset.uni-kassel.de/pls/w3isetdad/www_iset_new.main_page?p_name=7320000&p_lang=eng
With a bit of research, you’ll find everything you ever wanted to know about wind power and grid integration.
Questioning the messenger’s motives because you don’t like the message is not the best strategy for finding investments that will increase rather than decline in value. If your interest is investing, the vulgar exigencies of objective truth should be the only metrics that matter.
We know to a certainty that putting a dozen severely bi-polar patients together in the common room of an asylum does not lead to a stable group, yet we blithely assume that putting a dozen severely bi-polar wind power regions together in an interconnected grid will result in stability.
Sufficient hard data to prove or disprove the theory exists. The assumption free analysis I’ve seen is not encouraging. Further assumption based argument at this point is futile. Get the hard data, put it together in real time and study the results. This is not an opinion question. It’s a fact question. I don’t know the answer but I have no interest in studying opinions when facts work better.
Ok. I found hourly weather data for all of Canada here:
http://climate.weatheroffice.gc.ca/climateData/canada_e.html
I have not processed it, but are you willing to make a gentleman’s bet with me that the wind speed in St. John’s, Newfoundland is significantly less correlated with the wind speed in Vancouver B.C. than the wind speed in Prince George, B.C.?
I’m willing to be that the correlation coefficient between the wind speed in Vancouver and St. Johns is less than 0.25. Will you bet that it’s higher?
Not at all. In fact I’ll readily concede that wind speed on the East Coast of Canada is quite different from wind speed on the West Coast. Unfortunately the fact that conditions vary over the breadth of a continent does not resolve the problem.
For geographic dispersion to work in practice there needs to be an inverse correlation of comparable magnitude so that strong wind conditions in the East offset and balance out weak wind conditions in the West.
While I believe a positive correlation is unlikely, I’m certain that an inverse correlation of comparable magnitude is even less likely.
The analysis would be simple enough to do. Take a year’s worth of data at 15 minute intervals for every wind turbine in the country, or for that matter a statistically valid sample in each region. Add them all together and then draw a graph. The graph would be a reliable picture of what you could have had with a robust and highly interconnected grid.
Perform the same exercise with a few years of data and you’ll have a pretty good idea of what the future holds and what the optimal deployment path might look like.
Without a careful and complete analysis of hard data, we’re pissing in the wind with speculation and conjecture.
Chaos demands to be recognized and experienced before letting itself be converted into a new order.
—Hermann Hesse
I’m an investing newbie, but my climate education predates my investing experience. I would have needed considerable evidence before agreeing to John’s initial three assumptions. They don’t seem that reasonable at current grid scales. Tom touches on an excellent idea though. A wind farm off Newfoundland would probably do quite well. First of all, the wind would often coincide with people’s heating demands. Secondly, the project would match the nation’s stereotype of the area! (note tongue planted in cheek)
There’s some interesting research into kite wind power that recognizes the reduction in velocity variability at higher elevations. Unfortunately for us, the projects I’ve seen thus far (e.g., Crosswind) are at the opposite end of the scale spectrum from Tom’s cross-country scheme.
John,
Inverse correlation is only necessary to produce perfectly flat power output. Flat power output is unnecessary; utilities deal with fluctuating demand all the time. It is only necessary to reduce the level of variability so that it not too much more than the existing variability of demand. For that, all we need is a sufficient number of not-perfectly correlated wind sites.
You suggestion of collating all the data from existing wind sites is not workable because most wind farm operators and utilities treat such data as trade secrets. However, the wind speed data I linked to above can be converted into theoretical wind output, and I’m currently working using that theoretical power output from widely dispersed sites in Canada.
Marcia,
You hit on another idea that I’ve been writing about off and on for a couple years: electrical loads are not always fixed, and some can be chose to make better use of wind. One type of load that works well with wind is heating with geothermal heat pumps (And air to air heat pumps in warmer climates.) These add winter and shoulder month electrical loads, precisely at the times when wind performs best and other loads are often low. See: http://www.altenergystocks.com/archives/2008/09/wind_and_heat_pumps_a_winning_combination_1.html.
What about the infrastructure?
If the UK is too small for balancing wind differences, then that would mean a second UK is needed at some distance. Not the land, but grid and the wind farms, all equally big to supply the one UK. And because in general you don’t know where the wind blows, you need a couple of UKs to supply the only real one.
This applies to any wind park as it works one forth of the time and you need three others with the associated grid at a large distance to have the full capacity, i.e. replace a power plant.
Showstopper imho.
Same applies for the heat pump driving wind mill. What if you need heat and there is no wind? You still want that gas fired power station to work for you.
Water is much steadier and heavier than air, so more kW/kg steel. Wind farms in the sea seem absurd then, given the fact that the are currents in the sea everywhere.
Jan,
For the UK, the solution needs to be underwater HVDC links to the mainland.
And heat pumps and wind are just a good load fit; we still need dispatchable generation and demand response to balance supply and demand. long distance transmission simply means we need a lot less of each.
I’ve just published a more exhaustive rebuttal here:
http://www.altenergystocks.com/archives/2011/04/why_geographic_diversification_smooths_wind_power.html
Jan,
As Tom points out, HVDC lines are needed. And they’re getting built:
http://www.guardian.co.uk/environment/2011/apr/11/uk-netherlands-power-cable-britned
So much for your “showstopper”.
As for the supposedly “absurd “offshore wind, it’s the next big market. It’s now the fastest growing sector of the wind industry:
http://www.renewableenergyworld.com/rea/news/article/2011/02/wind-power-market-statistics
And the UK is the clear number 1 in the offshore sector.
Check your facts before spouting nonsense.
Here’s a paper- (from a reader at seeking alpha) which shows that wind in Montana is positively correlated with BPA load, and negatively correlated with the wind currently installed in BPA territory.
http://www.gaelectric.ie/uploads/file/Gaelectric Montana Wind – PNW Analysis.pdf
A quote from the paper’s conclusion:
“Central Montana wind resource positively correlates well
with many Pacific Northwest utility loads on a monthly and
hourly basis and has been shown to be counter-seasonal and
complementary on an hourly basis to the total wind on the
BPA transmission system. This is in line with previous research on the seasonal variation of CRG wind resource [7]. In addition, Central Montana wind resource is complementary to Pacific Northwest hydroelectric production and provides
competitive capacity factors to that of BPA system wind during their summer-peaking wind months.”