By Harris Roen
The US is by far the world’s greatest user of energy per capita in the world. Each American uses about 87,000 kilowatt-hours per year – that is twice as much as the European Union (EU), the next closest consumer! Understanding energy trends in this country is extremely important for investors who want to understand how the energy landscape will look 10, 20 or 30 years from now. 
The U.S. Energy Information Agency (EIA) made public an early release of its in-depth Annual Energy Outlook. This comprehensive report details likely trends in production, consumption, prices, and sources of energy out to 2040.
Figure 2 shows that although energy consumption will likely be lower in the next five years, this is only a short-term trend. The immediate reduction in energy use is mostly due to increased fuel efficiency standards kicking in, as well as other conservation and efficiency efforts.
Over the longer term, however, total U.S. energy consumption in 2040 is projected to continue to grow by an average of 0.3% annually, to between 9-10% above current levels. Consumption of liquid fuels (oil, gas, etc) is actually projected to drop by about 4.5%, while use of natural gas is expected to increase by almost a quarter above current levels.
The use of biofuels and renewables such as wind and solar are also expected to increase dramatically. Utilization of biofuels is expected to increase by 60%, and use of other renewables should be three quarters greater than they are now.
Figure 3 shows the same information in a different format. Each fuel type is shown as a percent of the total fuels consumed. A sharp eye can see a decrease in the amount of liquid fuels used, and an increase in renewables. Still, those renewables will comprise less than 10% of the overall energy picture, even projected 30 years out! Put another way, fossil fuels are expected to account for 80% of the energy consumed in 2040, which is only 5% less than they do now. The days of drilling and coal mining are not coming to an end any time soon.
Figure 4 illustrates that between 20-25% the oil will remain imported, despite the domestic oil boom going on now in and around North Dakota. Supplies of domestic natural gas, however, are expected to continue to increase at a greater rate than they are being consumed domestically which should feed expanded export markets (this is an investment opportunity for another article).
Despite what looks like a continued status quo for several decades, the dramatic increase in renewables is something energy investors need to pay attention to. Figure 5 reveals the projected growth of electric generation by type of renewable. Photovoltaic is slated to grow by 15% annually, which should make solar panels at least 25 times more ubiquitous by 2040!
The pie slices in Figure 5 measure the share of the projected growth that each type of renewable source will have. It is clear to see that photovoltaic and solar thermal combined should account for well over half of the growth in renewables.
What does this mean for alternative investors today? Despite the fact solar as a sector has been extremely beaten down, it would be foolish for the long-term investor to ignore the industry as a whole. Photovoltaic manufacturers are hurting because of the overproduction of cells. Additionally, the industry is suffering from a widening tariff war between China, the U.S. and the E.U., an atmosphere that is never good for business.
Buying individual photovoltaic stocks now may be a bit like catching a falling knife, since there will likely be more bankruptcies and other disappointments. Having said that, 15% annual growth cannot be disregarded. A well-diversified portfolio of solar stocks could be an excellent move for the long-term investor.
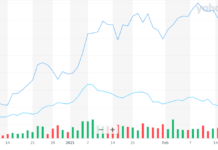
I have written before that I like installation companies as a group within the solar sector. Investors that scooped up shares of the newly issued solar installer SolarCity (SCTY) have done extremely well, up over 20% from its opening on December 13. While SolarCity may be a good long-term play as part of a speculative portfolio, it is not for the faint of heart considering that it has nowhere near positive earnings yet.
An additional installation company that the Roen Financial Report tracks is Ameresco Inc (AMRC). Its stock price was beaten down in November on an earnings release. The company showed decent growth in profits and earnings per share since March, but still showed a 25% drop in revenues compared to the same quarter last year. In addition, the company dropped its revenue guidance to between 7-10% lower than analyst expectations. Still, I think the company is fairly valued in the $10/share range.
In summary, the EIA foresees no game-changing shift in the U.S. energy landscape, and caution is advised for the alternative energy investor. If you want to be where the growth is, though, solar needs to be on your radar.
Harris Roen is Editor of the “ROEN FINANCIAL REPORT” by Swiftwood Press LLC, 82 Church Street, Suite 303, Burlington, VT 05401. © Copyright 2010 Swiftwood Press LLC. All rights reserved; reprinting by permission only. For reprints please contact us at cservice@swiftwood.com. POSTMASTER: Send address changes to Roen Financial Report, 82 Church Street, Suite 303, Burlington, VT 05401. Application to Mail at Periodicals Postage Prices is Pending at Burlington VT and additional Mailing offices.
DISCLOSURE: No positions in or plans to purchase any of the stocks mentioned,
DISCLAIMER: Swiftwood Press LLC is a publishing firm located in the State of Verm
ont. Swiftwood Press LLC is not an Investment Advisory firm. Advice and/or recommendations presented in this newsletter are of a general nature and are not to be construed as individual investment advice. Considerations such as risk tolerance, asset allocation, investment time horizon, and other factors are critical to making informed investment decisions. It is therefore recommended that individuals seek advice from their personal investment advisor before investing.
These published hypothetical results may not reflect the impact that material economic and market factors might have had on an advisor’s decision making if the advisor were actually managing client assets. Hypothetical performance does not reflect advisory fees, brokerage or other commissions, and any other expenses that an investor would have paid.
Some of the information given in this publication has been produced by unaffiliated third parties and, while it is deemed reliable, Swiftwood Press LLC does not guarantee its timeliness, sequence, accuracy, adequacy, or completeness, and makes no warranties with respect to results obtained from its use. Data sources include, but are not limited to, Thomson Reuters, National Bureau of Economic Research, FRED® (Federal Reserve Economic Data), Morningstar, American Association of Individual Investors, MSN Money, sentimenTrader, and Yahoo Finance.





In your second sentence, you have stated “…87,000 kilowatts/year.” The watt unit is already a rate – “kilowatts/year” is nonsense. It’s like saying “I drive at 65 miles per hour per hour.” You meant kilowatt hours per year. This is a rate of about 9.9 kilowatts and agrees reasonably well with numbers I’ve used and gleaned.