By Harris Roen
| Industry | Day | Week | Qtr | Year |
|---|---|---|---|---|
| Energy Efficiency | -0.3% | 2.3% | 18.7% | 49.9% |
| Environmental | -0.2% | 1.1% | 9.8% | 11.8% |
| Fuel Alternatives | -0.3% | 1.3% | 19.6% | 29.2% |
| Smart Grid | -0.1% | 2.4% | 9.5% | 31.9% |
| Solar | 0.5% | 6.8% | 40.3% | 52.8% |
| Wind | 0.0% | 2.1% | 9.7% | 21.6% |
| Average | -0.1% | 2.7% | 17.9% | 32.9% |
| Data as of: 7/17/2013 | ||||
Alternative energy stocks are up over 30% on average for the year, reflecting impressive gains off of widely oversold lows in 2012. Almost three-quarters of stocks have been gainers, and two-thirds have seen double-digit price growth in the past 12 months. Solar and energy efficiency stocks in particular have done extremely well, both up over 50% annually.
Solar
The run-up in solar stock prices exhibit strength and breadth. For example, almost four out of five solar stocks are up in both the past three-month and 12-month time periods.
The best performer is SunPower Corp (SPWR), up 505% for the year! This vertically integrated, California-based solar company works at all levels of the photovoltaic business: from manufacturing to installation to service; and from rooftop residential to commercial to utility-scale. Caution is advised, though, since SPWR is still in negative earnings territory. Because SunPower is well positioned in the growing solar installation market, however, we believe that this energy stock is a good long-term prospe
ct.
Energy Efficiency
Energy efficiency stocks have also done extremely well, with over 70% of companies posting annual gains in the double digits. The return leader here by far is Revolution Lighting Technologies Inc. (RVLT), a company that is worth 20 times what it was a year ago. Investors see RVLT as a strong play in the push for increasing efficiency in electric consumption by greater adoption of LEDs.
As with SPWR, it is hard to suggest investing in this and other high flyers except for a speculative portion of one’s portfolio. Having said that, these and other high-quality green investments will more than likely pay off as a buy-and-hold for the long-term.
Market Bottom?
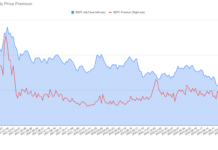
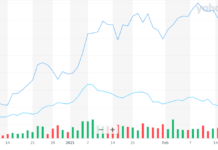
On a technical basis, alternative energy stock prices look like they have formed a bottom. The chart below shows the WilderHill New Energy Global Index (NEX), which after flying high for a couple of years dropped 66% off its peaks in 2007. The downward pattern, however, shows a clear triple bottom. Three times, a new low occurred below the previous downward trough creating a wave-like pattern. This typically happens in three or four waves before a significant upturn begins.
In addition, the 200-day moving average crossed the 50-day moving average in December 2012, and the NEX has been trading above the 200-day moving average since that time. This can be an early sign of a prolonged upswing, as occurred in September 2006. The crossing marked the start of a 15 month, 83% surge.
Investors should be vigilant and monitor to see if the two moving averages cross again. This can indicate a false bull, as happened with the run between May 2009 and February 2010. Alternatively, it can signify the start of decline. This was foretold by the two moving averages crossing in February 2008, which preceded the precipitous drop later that year.
Unless the NEX starts forming a short-term top, we believe the two moving averages should remain widely apart as the recovery in clean energy continues.
Disclosure
Individuals involved with the Roen Financial Report and Swiftwood Press LLC do not own or control shares of any companies mentioned in this article. It is possible that individuals may own or control shares of one or more of the underlying securities contained in the Mutual Funds or Exchange Traded Funds mentioned in this article. Any advice and/or recommendations made in this article are of a general nature and are not to be considered specific investment advice. Individuals should seek advice from their investment professional before making any important financial decisions. See Terms of Use for more information.
About the author
Harris Roen is Editor of the “ROEN FINANCIAL REPORT” by Swiftwood Press LLC, 82 Church Street, Suite 303, Burlington, VT 05401. © Copyright 2010 Swiftwood Press LLC. All rights reserved; reprinting by permission only. For reprints please contact us at cservice@swiftwood.com. POSTMASTER: Send address changes to Roen Financial Report, 82 Church Street, Suite 303, Burlington, VT 05401. Application to Mail at Periodicals Postage Prices is Pending at Burlington VT and additional Mailing offices.
Remember to always consult with your investment professional before making important financial decisions.


