Tom Konrad CFA
Disclosure: I and my clients own HASI and BEP. I have short call positions in NYLD and PEGI, and short put positions in PEGI.
Dollars per watt ($/W) is a lousy measure of the economics of solar, but it persists.
Most likely, it persists because it seems familiar. We can pay $4 for a watt of solar, or $4 for a Iced Hazelnut Macchiato at Starbucks. Unfortunately, while the analogy may seem apt, this is a lot like knowing you’re getting a Macchiato without knowing if it’s a Tall, Grande, or Venti. The actual energy production from a solar system depends greatly on a number of factors, including location, orientation, mounting structure, shading, string configuration, and choice of inverter.
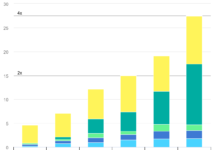
Nevertheless, dollars per watt persists. You’ll find it even in industry reports like US Solar Market Insight from GTM Research, as seen in this graph of annual PV installations and cost in dollars per watt:
Dollars of Stock Per Watt
Knowing that I can’t beat them, I decided to join them. I used dollars per watt to provide a rough guide of how much solar an investor gets when buying the stock of publicly traded companies that own or finance solar: SolarCity (NASD:SCTY), NRG Yield (NASD:NYLD) and Hannon Armstrong Sustainable Infrastructure (NYSE:HASI) in a recent article about solar leases.
Here, I take it a little farther, and look at $/W for all renewables. Below I also include wind farm owner and developer Pattern Energy Group (NASD:PEGI), geothermal company Ormat Technologies, Inc (ORA:NYSE) and hydropower and wind partnership Brookfield Renewable Energy Partners (NYSE:BEP.) I dropped Hannon Armstrong from the list because I was not able to obtain sufficient information from the company about the renewable projects it has financed in time for publication.
The following chart shows how much of each company’s stock you would have to buy to get a watt of each type of renewable energy production:
Note that one weakness of $/W is that the numbers are not additive. If you spend $43 on a share of NRG Yield, you will be effectively buying a little over 2 watts of wind power and a little over 6 watts of solar. You can’t get the solar without the wind. If you only want one watt of any renewable energy, the green bars show that you could spend about $2.50 on either Brookfield or Pattern, $3.63 on Ormat, $5.05 on NRG Yield, or $13.89 on SolarCity.
Of course, renewable energy is not all you get when you buy these companies. With SolarCity, you also get the solar installation business, and Ormat has a significant business selling equipment and services to other geothermal companies. Most of NRG Yield’s business is not renewable at all: it also provides heating and cooling in commercial facilities, and has significant natural gas generation. About 3% of Brookfield Renewable Energy Partners’ generation is from two natural gas co-generation facilities acquired “as part of larger hydro portfolio transactions many years ago,” according to a company spokesman.
While dollars per watt can be easy to grasp when thinking about just one technology, the metric starts to suffer when we consider a portfolio of several businesses. Things become a little clearer when you consider watts bought per dollar spent. The following chart shows how many watts of each type of business you would get if you bought $100 worth of each company’s securities:
Conclusion
Dollars per watt is at best a rough starting point when evaluating a bid for solar on your home, or for evaluating companies that own renewable energy generation. On the other hand, it works well with the intuition we’ve honed with years of trips to the grocery store and coffee shops. That intuition may make these charts useful as you develop your understanding of renewable energy power producers.
DISCLAIMER: Past performance is not a guarantee or a reliable indicator of future results. This article contains the current opinions of the author and such opinions are subject to change without notice. This article has been distributed for informational purposes only. Forecasts, estimates, and certain information contained herein should not be considered as investment advice or a recommendation of any particular security, strategy or investment product. Information contained herein has been obtained from sources believed to be reliable, but not guaranteed.


