Tom Konrad CFA
The first two months of 2016 have been chilly ones for the market, and for clean energy stocks. In addition to the worries about the world economy and plunging oil prices which have been hitting stocks in general, the clean energy sector had to deal with the Supreme Court’s stay on Obama’s Clean Power Plan. This effect was mitigated the following week by the lost of conservative Justice Scalia, but many states’ subsequent delays of their compliance plans have put an additional chill on clean energy stocks, even ones which are unlikely to be affected.
In January and February, my Ten Clean Energy Stocks for 2016 model portfolio declined 13.5%, slightly worse than its benchmark (see below), which fell 11.5%. The seven income stocks were down 11.2% on average, slightly below my income benchmark, the Global X Yieldco ETF (YLCO.) The three growth stocks declined 18.8%, also behind their benchmark, the Powershares/Wilderhill Clean Energy ETF (PBW), which fell 13.9%. The overall benchmark mentioned above is a 70/30 blend of the income and growth benchmarks.
The Green Global Equity Income Portfolio, a seed account investing in green income stocks which I manage performed outperformed all of them, falling only 4.7% year to date. It under-performed the much smaller income model portfolio last year, so but now it seems to be making up for lost time.

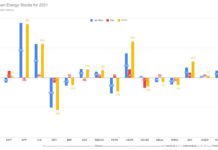
The chart above gives detailed performance for the individual stocks. Significant news driving individual stocks is discussed below.
Income Stocks
Pattern Energy Group (NASD:PEGI)
12/31/15 Price: $20.91. Dec 31st Forward Annual Dividend: $1.488 (7.1%). Beta: 1.22. Low Target: $18. High Target: $35.
2/29/16 Price: $16.98. YTD Dividend: $0. Forward Annual Dividend:$1.524 (9.0%) YTD Total Return: -18.8%
Wind Yieldco Pattern Energy’s decline so far this year is completely unexplained by news. The company’s fourth quarter results were strong, and it increased its dividend for the eighth consecutive quarter since its IPO. Even assuming the stock price does not recover and it cannot sell additional shares at an attractive price, the company has sufficient capital to increase Cash Available for Distribution (CAFD) to about $156M ($2.06 per share) over the next couple years, which would translate to a 12.2% yield at the current price.
Expect the continued dividend increases will eventually bring the price up, and allow further secondary offerings which can in turn accelerate growth. At a 7% yield, a $2.06 annual dividend translates to a $29.43 share price, or a 73% increase on the current price. While we’re waiting for these capital gains, we are collecting a very healthy and growing 9.0% yield.
Enviva Partners, LP (NYSE:EVA)
12/31/15 Price: $18.15. Dec 31st Forward Annual Dividend: $1.76 (9.7%). Low Target: $13. High Target: $26.
2/29/16 Price: $19.39. YTD Dividend: $0.46 Forward Annual Dividend: $2.10 (10.8%) YTD Total Return: 9.4%
Wood pellet focused Master Limited Partnership (MLP) and Yieldco Enviva Partners has been one of the few bright spots in the portfolio. Its gains have come because, like most Yeildcos, its long term contracts insulate it from the economy, and its results have nothing to do with the price of oil.
The company exceeded its guidance by completing an asset drop-down from its parent ahead of schedule, and provided new guidance for total distributions in 2016 of at least $2.10, 19% over its annual distribution rate at the end of 2015.
Green Plains Partners, LP (NYSE:GPP)
12/31/15 Price: $16.25. Dec 31st Forward Annual Dividend: $1.60 (9.8%). Low Target: $12. High Target: $22.
2/29/16 Price: $12.85. YTD Dividend: $0.4025. Forward Annual Dividend: $1.61 (12.5%) YTD Total Return: -18.4%
Like Enviva, Green Plains is a new MLP and Yieldco. The company’s contracts with its parent, Green Plains (GPRE), also insulate it from the general level of economic activity and commodity markets. However, this insulation is only as good as its parent’s solvency. While GPRE has a strong balance sheet, its ethanol operations are exposed to commodity markets, especially the oil price.
Although Green Plains Partners also increased its distributions, the increase was small. Because of this, GPP has declined along with the market and the oil price. Should the oil price continue to recover, I would expect that to be reflected in GPP’s price.
NRG Yield, A shares (NYSE:NYLD/A)
12/31/15 Price: $13.91. Dec 31st Forward Annual Dividend: $0.86 (6.2%). Beta: 1.02. Low Target: $11. High Target: $25.
2/29/16 Price: $12.38. YTD Dividend: $0.225. Forward Annual Dividend: $0.90 (7.2%) YTD Total Return: -9.4%
I included Yieldco NRG Yield (NYLD and NYLD/A) in this list because the stock had fallen so far because of management changes at its parent NRG and the Yieldco selloff that I felt it now represents a compelling value. This is in sharp contrast to the start of 2015, when, at nearly three times its current price, I thought it was so overvalued that I was short the stock.
Despite the troubles and redirection at its parent, NRG Yield raised its first quarter dividend to $0.225, and reaffirmed its target dividend for Q4 of $0.25, which would translate to an 8% annual yield at the current price.
Terraform Global (NASD: GLBL)
12/31/15 Price: $5.59. Dec 31st Forward Annual Dividend: $1.10 (19.7%). Beta: 1.22. Low Target: $4. High Target: $15.
2/29/16 Price: $3.17. YTD Dividend: $0. Forward Annual Dividend: $1.10 (34.7%). YTD Total Return: -43.3%
Terraform Global’s stock has been suffering because it’s sponsor and controlling shareholder, SunEdison (SUNE) is flirting with bankruptcy, and investor worries that the Yieldco wsill be drawn in, or at the very least have to cut its dividend. 
;
At the end of February, the company reaffirmed its $0.275 quarterly dividend, which should help to allay dividend cut fears in the short term. The company will announce its fourth quarter results before the end of March.
At the end of the third quarter, the company had $9.50 in cash and $7.48 in book value (mostly solar projects, less debt) per share. So long as SunEdison does not have access to these assets in a bankruptcy, buying them for $3.17 with a $0.275 dividend on the way seems like a screaming deal. Here is what credit agency Moody’s has to say about the likelihood of losing control of those assets:
“The assets and cash flows of the yieldcos would only be available to SUNE’s creditors in case of a SUNE bankruptcy if a substantive consolidation of the yieldcos into a SUNE bankruptcy were ordered by a bankruptcy judge. … [W]e consider the likelihood of this event to be remote.”
Hannon Armstrong Sustainable Infrastructure (NYSE:HASI).
12/31/15 Price: $18.92. Dec 31st Forward Annual Dividend: $1.20 (6.3%). Beta: 1.22. Low Target: $17. High Target: $27.
2/29/16 Price: $17.61. YTD Dividend: $0. Forward Annual Dividend: $1.24 (7.0%). YTD Total Return: -6.9%
Clean energy financier and REIT Hannon Armstrong has been benefiting from the 2015 Yieldco melt-down. The withdrawal of most Yieldcos from the solar and wind financing markets has given Hannon more pricing power. This allowed them to renegotiate some new financings in the fourth quarter. The delays hurt fourth quarter performance, but the better terms will help with results going forward. As a result of these better terms and better opportunities in general, HASI has increased the upper end its dividend guidance range to 14% to 18% from its previous guidance of 14% to 16%. It also expects double digit growth in 2017.
HASI generally raises its dividend in the fourth quarter. The above guidance implies that the 4th quarter dividend will be between $0.34 and $0.36, and the dividend will be raised another 4 to 7 cents in 2017.
TransAlta Renewables Inc. (TSX:RNW, OTC:TRSWF)
12/31/15 Price: C$10.37. Dec 31st Forward Annual Dividend: C$0.84 (8.1%). Low Target: C$10. High Target: C$15.
2/29/16 Price: C$11.25. YTD Dividend: C$0.147 Forward Annual Dividend: C$0.88 (7.8%) YTD Total Return (US$): 8.9%
TransAlta Renewables completed a drop-down of a cogeneration plant, a wind farm, and a hydro facility in Canada from its parent, TransAlta Corp (TAC).
This increased Cash Available For Distribution per share to C$1.08 for 2015, and allowed another dividend increase to C$0.88 annually. Investors are beginning to appreciate the attraction of RNW’s slow but steady approach to dividend increases as compared to the roller-coaster ride of US Yieldcos, and the stock rose in the first two months while other Yieldcos were falling. A slight (2.4%) increase in the Canadian dollar helped US investors as well.
Growth Stocks
Renewable Energy Group (NASD:REGI)
12/31/15 Price: $9.29. Annual Dividend: $0. Beta: 1.01. Low Target: $7. High Target: $25.
2/29/16 Price: $7.29. YTD Total Return: -21.5%
Advanced biofuel producer Renewable Energy Group (REG) suffered in January because of the continuing slump in the oil price, but it (and, possibly the oil price) seem to have begun coming back since then.
The oil price has had worse effects on less well capitalized biodiesel firms, and this allowed REG to acquire its 11th US biodiesel plant just as the industry is poised for a boom because of increased volumetric requirements under the Renewable Fuel Standard, and the reinstatement of the biodiesel blender’s tax credit. If the oil price continues to recover, that should help REG as well.
The company will report 2015 results on March 8th.
MiX Telematics Limited (NASD:MIXT; JSE:MIX).
12/31/15 Price: $4.22 / R2.80. Dec 31st Forward Annual Dividend: R0.08 (2.9%). Beta: -0.13. Low Target: $4. High Target: $15.
2/29/16 Price: $3.47 / R2.20. YTD Dividend: R0.02/$0.12 Forward Annual Dividend: R0.08 (3.6%) YTD Total Return: -17.0%
Software as a service fleet management provider MiX Telematics released its third quarter results in February. The company remains on track with 16% year over year subscription growth and 11% year over year subscriber growth despite the pressure the oil price puts on its customers in the oil and gas industry. MiX maintained its guidance for its fiscal 2016 year, which ends on March 31st.
The market seems to be ignoring the steady results, and the stock decline is affording investors the opportunity to buy a growth stock at value stock prices. How many stocks have both a 3.6% dividend and a business growing in the double digits?
In addition, MiX has $1.85 worth of cash per share, a P/E ratio of 7.7, and EV/EBITDA of 3.3 (anything below 8 is usually considered good.) For comparison, its US competitor Fleetmatics (FLTX) has a P/E of 36 and an EV/EDITDA of 17.9. FLTX is growing a little faster, at about 20% a year, but has less cash and does not pay a dividend.
Ameresco, Inc. (NASD:AMRC).
Current Price: $6.25. Annual Dividend: $0. Beta: 1.1. Low Target: $5. High Target: $15.
2/29/16 Price: $5.14. YTD Total Return: -17.8%
Energy service contractor Ameresco also fell before results were released on March 3rd. Although these results showed that the business is recovering (especially its government energy contracting business), the stock has not shown much life.
Management and company insiders are extremely optimistic, as shown both by their statements and by their purchases of company stock. But after the company’s long downturn, it will probably take a few more quarters of accelerated improvement in the bottom line before the mass of investors again joins them.
Final Thoughts: Buy!
In my decade and a half watching the stock markets, I have only seen as many compelling buying opportunities as I see today at the start of 2009. From its low in February 2009 to its recent peak, the S&P 500 nearly tripled.
I’m excited about most of the stocks on this list at their current prices, but Pattern and MiX Telematics all stand out as screaming bargains, while Terraform Global is one of the most compelling speculations I’ve seen in a very long time.
I can’t say this enough: If readers have any cash still on the sidelines in this market, now is the time to buy. Buy and keep reinvesting the extrem
ely high dividends on offer until prices rise. It is always possible for stocks to fall further, but when investing in dividend stocks like Pattern and MiX with the cash flows to continue and grow those dividends in any economy, you get (generously) paid to buy now and wait.
Disclosure: Long HASI, AMRC, MIXT,, RNW/TRSWF, PEGI, EVA, GPP, NYLD/A, REGI, GLBL.
DISCLAIMER: Past performance is not a guarantee or a reliable indicator of future results. This article contains the current opinions of the author and such opinions are subject to change without notice. This article has been distributed for informational purposes only. Forecasts, estimates, and certain information contained herein should not be considered as investment advice or a recommendation of any particular security, strategy or investment product. Information contained herein has been obtained from sources believed to be reliable, but not guaranteed.


PEGI an 18 month window beginning 7/1/2015 to reintegrate the parent company, Pattern Development (PEG LP), into PEGI. I suspect much like IDRs there may be pros and cons to this potential arrangement. It would be nice to get a clear understanding of the financial implications of this proposal before it is acted upon. Do you have any thoughts on this subject?
I generally like the idea of merging the two. The pros are that there is much less conflict of interest, the con is that development is riskier (and higher reward) than ownership, so it changes the risk profile of the yieldco. I think that’s OK so long as most of the cash flow comes from ownership.
Tom, thanks for the response. I was under the assumption that the structure of a Yeildco precluded a development function, i.e, only management of existing facilities. Obviously I am wrong if PEGI reintegrates Pattern Development. One question remains for me is how would the combined company affect the CAFD to current shareholders of PEGI. I could envision that more would be diverted for development and servicing a higher debt load.
There is no legal definition of a Yieldco, so nothing is prohibited that’s not against the corporate bylaws. This reintegration was described in the IPO documents, so it was expected.
As for the effect on CAFD per share, I would expect it to increase with the reintegration, but also become more volatile. Asset development is a very profitable business, but the income comes in big, uneven chunks. That’s why it’s important for most of the cash flow to come from stable asset ownership.