This is Part Two of a three part series based on a rare earth elements (REE) review which is available for download at slideshare, where references can be viewed. Part 1 is an introduction to REEs. Part 2 analyzes REE consumption and refining and Part 3 looks at how REEs might affect the green economy.
So where do all those REEs go? Figure 8 shows the estimated flows for 2008 [15]. Although Chinese consumption is shown as 60%, this is only for the raw elements. Some of the downstream products will still be exported to the west. Japanese industry is a large consumer of REEs, and so they are almost beside themselves over the REE situation [41].
Figure 8: 2008 Estimated Rare Earth Flows
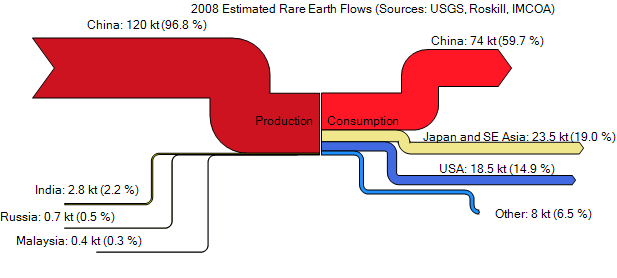
Figure 9 presents a chart I made showing the estimated 2010 global production capacity for each element (from Byron Capital Market’s John Hykawy [18]), together with the rare earth usage demand sectors projected by Lynas for 2010 [15]. You’ll have to click to enlarge, a direct link to the photobucket version is here. Christian Hocquard, an economist at BRGM, put together an excellent and comprehensive presentation on rare earths in May 2010 [15]. The breakdown by application for magnets and phosphors comes from that presentation.
Figure 9: Indicative rare earth flows for 2010
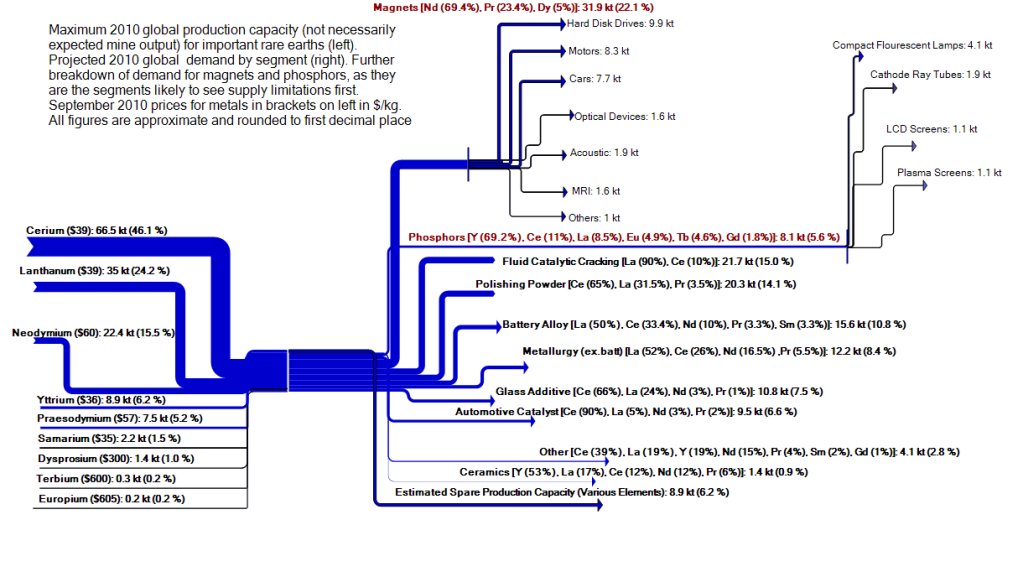
Figure 10 shows the data in brackets on the right hand side of Figure 9 in a more readable fashion [15].
Figure 10: REE Composition by End Use
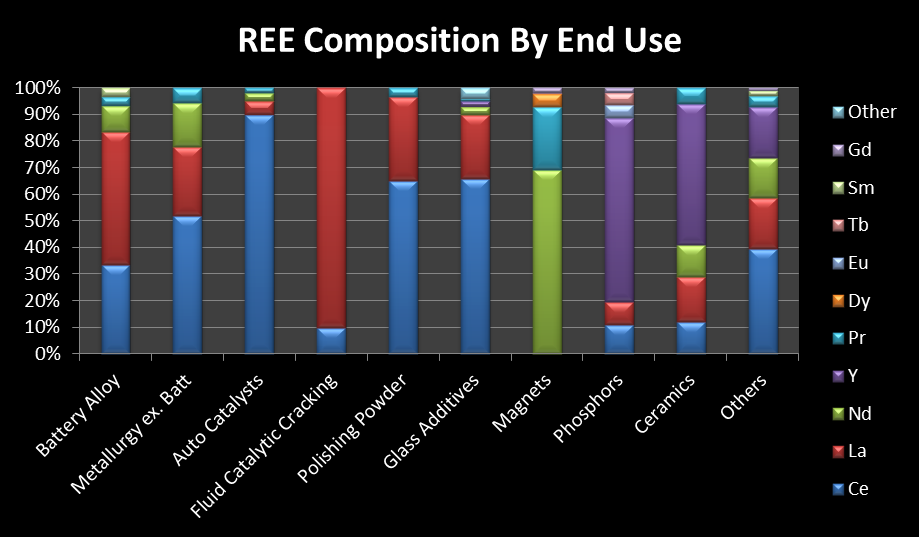
Figure 11 shows the breakdown of ores for most elements for currently producing mines and the assays for mines which are mostly still fishing for capital [18, 39].
Figure 11: Approximate Percentage Content of Current and Prospective Ores
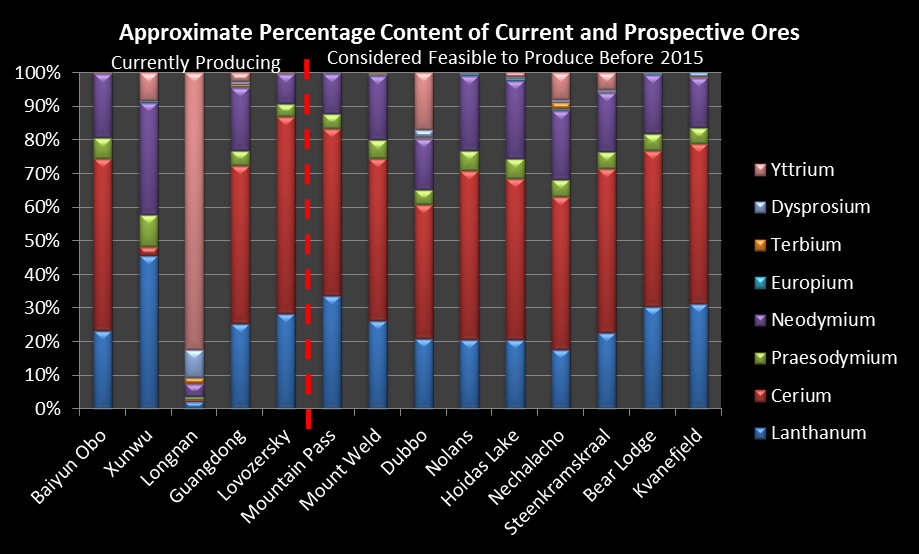
You may have to squint a bit to see the components of dysprosium, terbium and europium. They are shown more clearly in Figure 12.
Figure 12: Europium, Terbium & Dysprosium Content of Current and Prospective Ores
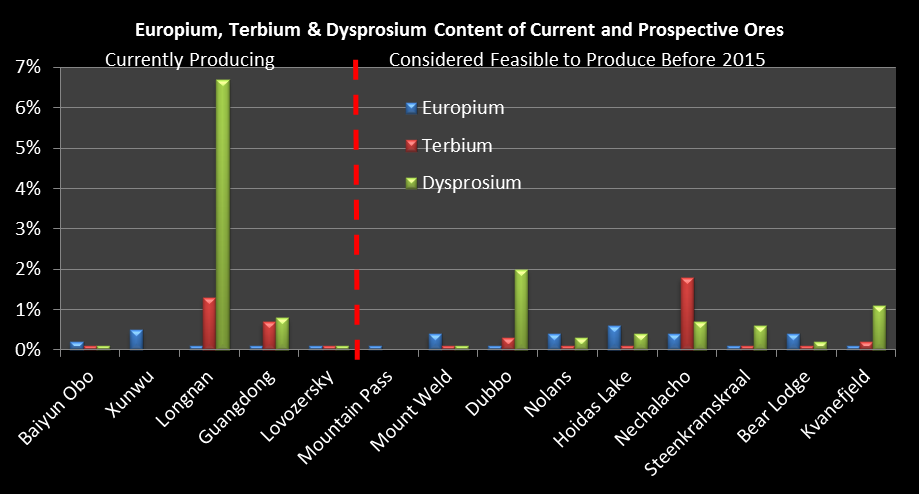
Looking at Figures 9-12, a couple of observations are evident:
· If the demand for magnets were to double, from the current 31.9kt to 63.8kt, and a 5% dysprosium content is assumed, additional dysprosium demand of 1.6kt would be required. The ore with the highest dysprosium content is Dubbo, at 2%. Therefore, in order to satisfy demand, the other 98% must be mined also. In the case of Dubbo, this would release onto the market: 16kt lanthanum, 30kt cerium and 11kt neodymium. Hence a market for an additional 50% of cerium would have to be found. Based on the prices in Figure 9, while dysprosium provides 13% of the mine’s revenue, cerium provides 31%. So, for the mine to be viable, either growth in the use of cerium is required or else the price of dysprosium must appreciate. For example, if the price of dysprosium triples to $900/kg, then the share of dysprosium in overall revenue increases to 31%.
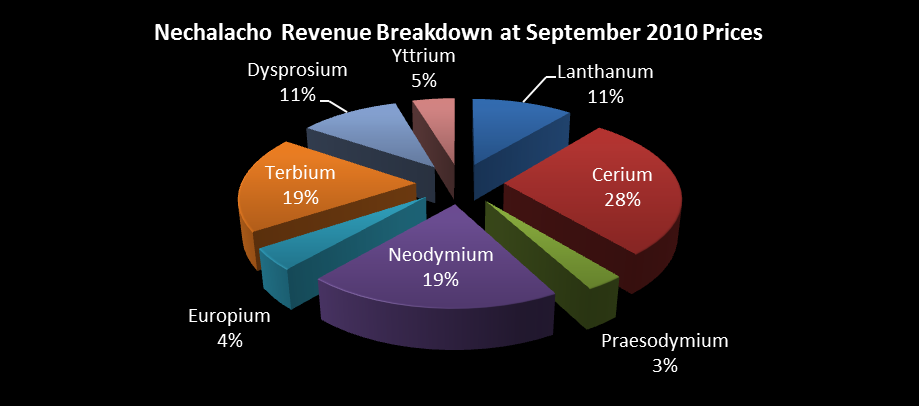
· If the demand for phosphors doubles, from the current 8.1kt to 16.2kt, and a 4.6% terbium content is assumed, additional terbium demand of 373 tonnes would be required. The only mine with any appreciable amounts of terbium is Nechalacho, at 1.8%. Nechalacho only plans to produce 5kt [18]. Hence this would provide 90 tonnes of terbium per year (5,000*0.018). The breakdown of revenue is better for the specific ore at Nechalacho. This is shown in Figure 13. That still leaves 283 tonnes of terbium required (373-90). The next highest terbium mine content is Dubbo, at 0.3%. For Dubbo to output 0.283kt of terbium, a market for a stonking 94kt of other rare earths is required, or about 75% of 2009 demand.
Figure 13: Nechalacho Revenue Breakdown at September 2010 Prices
4. Refining
Bertram Boltwood, 1905 [45]:
“In point of respectability your radium family will be a Sunday school compared with the rare earth elements, whose chemical behaviour is simply outrageous. It is absolutely demoralizing to have anything to do with them”
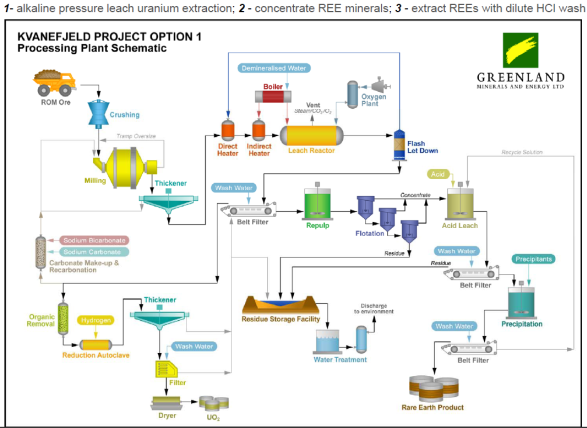
Refining (or reduction in mining lingo) is very important. Figure 11 shows the composition for 14 different ore compositions. Each one requires an individual, detailed flow sheet, their own reagents and refining processes. An investor could do well to read the book “Extractive Metallurgy of the Rare Earths” [11]. This is not your father’s extractive metallurgy. Whereas with gold, for example, you might just add a bit of borax and soda and out it comes, rare earths are much more troublesome. I won’t bore you with the details. Figure 14 shows an example flow sheet. It is dirty, requires lots of water, heaps of chemicals and is very capital intensive. Capital intensive processes can be prone to cost overruns and delays, which should be borne in mind for any companies with mine-to-market strategies.
Figure 14: Kvanefjeld Flow Sheet [20]
Continued in Part III. References are available here.