A couple of weeks ago, I noted the importance of examining parameters other than module costs when gauging the economic competitiveness of solar PV energy. I noted how multiple factors influence the levelized cost of energy produced by solar PV systems, and thus its relative cost position on the grid. Nothing new here.
However, besides standard test conditions (STC) conversion efficiency, or nameplate conversion efficiency, public data on parameters other than cost per watt-peak is not always easy to come by. That’s why I found reading “Potential of photovoltaic systems in countries with high solar irradiation“, a paper about to be published in the journal Renewable and Sustainable Energy Reviews, particularly interesting.
The Study
In the authors’ own words, the paper reports the results of the following study (funded by the German Federal Ministry for the Environment, Nature Conservation and Nuclear Safety (BMU)):
More specifically, the installed PV technologies […] consist of twelve fixed plate mounted systems, a two-axis tracking system and a flatcon concentrator system. The systems range from monocrystalline, multi-crystalline silicon to amorphous silicon, CdTe, CIGS, HIT-cell and other solar cell technologies from a range of manufacturers such as Atersa, BP Solar, Mitsubishi, Sanyo, Solon, SunPower, etc.
The PV modules are mounted on mounting racks at the optimal inclination to provide maximum annual yield for each respective location.
This study thus examines the performance of the main commercially-available solar PV cell technologies under the same real-world conditions, rather than in the lab. The annual solar irradiation measured on-site at the ideal inclination was 1997 kWh/m2 in Cyprus and 1460 kWh/m2 in Germany. This equates to roughly 5.5 kWh/m2/day and 4.0 kWh/m2/day, respectively. The NREL Photovoltaic Solar Resource map provides a rough guide to equivalent US locations, while Solar4Power’s global maps do the same for the rest of the globe.
The systems were initially deployed in June 2006 and the data reported is for the first year of operation, so until June 2007.
The systems under study are as follows:
| Manufacturer (Ticker) | Technology | System Power (Wp) | Size (m2) | Nameplate Module Efficiency (%) |
| Atersa (uses Q-Cells cells, QCLSF.PK) | Mono-crystalline silicon (tracker) | 1020 | 7.90 | 12.9 |
| Atersa (uses Q-Cells cells, QCLSF.PK) | Mono-crystalline silicon | 1020 | 7.90 | 12.9 |
| BP Solar (BP) | Mono-crystalline silicon (Saturn-cell) | 1110 | 7.52 | 14.8 |
| Sanyo (SANYY.PK) | Mono-crystalline silicon (HIT-cell) | 1025 | 6.26 | 16.4 |
| Suntechnics (Uses Sunpower cells, SPWRA) | Mono-crystalline silicon (back contact-cell) |
1000 | 6.22 | 16.1 |
| Schott Solar (Private) | Multi-crystalline silicon (MAIN-cell) | 1020 | 7.87 | 13.0 |
| Schott Solar (Private) | Multi-crystalline EFG silicon | 1000 | 8.58 | 11.7 |
| SolarWorld (SRWRF.PK) | Multi-crystalline silicon | 990 | 7.82 | 12.7 |
| Solon AG (SGFRF.PK) | Multi-crystalline silicon | 1540 | 11.50 | 13.4 |
| Mitsubishi (MIELY.PK) | Amorphous silicon (single cell) | 1000 | 15.74 | 6.4 |
| Schott Solar (Private) | Amorphous silicon (tandem cell) | 960 | 18.00 | 5.4 |
| First Solar (FSLR) | Cadmium Telluride | 1080 | 12.96 | 8.3 |
| Wurth (Private) | Copper–Indium–Gallium– Diselenide |
900 | 8.75 | 10.3 |
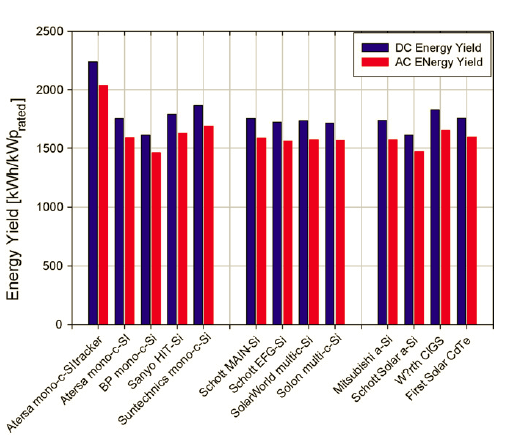
The study uses energy yield – kWh produced divided by nameplate kWp – to directly compare the performance of each system. Theoretically, this should normalize out conversion efficiency differences between the various systems and, because other key factors such as inclination are kept equal, the performances of the systems should be roughly equal.
The figure below displays the annual energy yield for the Cyprus location. Ignoring the tracker-equipped system, we note some non-trivial differences in AC energy yields between the various systems, with the Suntechnics (SunPower), Wurth, Sanyo and First Solar systems performing best, and the BP Solar and Schott a-Si systems performing worst.
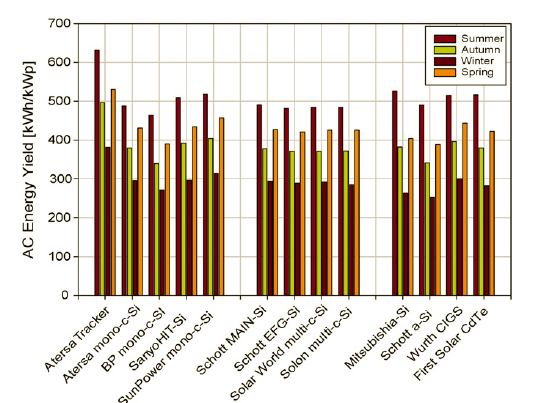
The figure below depicts the energy yield by season for the Cyprus location. As can be noted, the thin-film technologies (a-Si, CIGS and CdTe) tend to have higher energy yields in the summer months than most crystalline technologies, but perform in roughly similar fashions or even slightly worse in winter months.
The seemingly wider variations between summer and winter months for thin-film systems are not actually due to the properties of thin-film materials, but rather to the properties of crystalline materials. The table below displays deviation from the average AC energy yield across all systems, as well as the MPP power temperature coefficient. The latter metric shows the drop in system power per one kelvin increase in temperature.
As can be noted, overall, the crystalline technologies tend to experience much greater performance declines under warmer conditions than do their thin-film brethrens. The authors note that the technologies with the lowest MPP power temperature coefficients showed the highest average energy yields during the summer period.

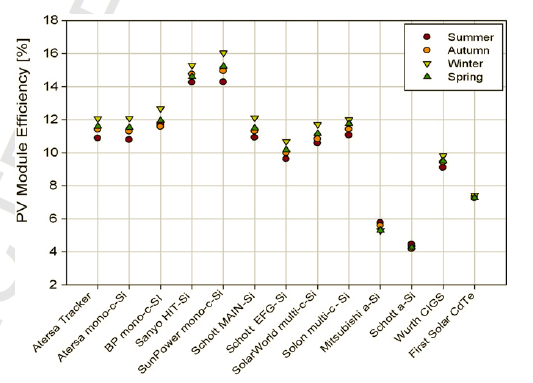
The phenomenon discussed above is perhaps best captured by the graph below, which displays seasonal module efficiency for the Cyprus systems. Once again, by-and-large, thin-film technologies tend to experience much lower drops in efficiency with higher temperatures than do crystalline technologies, with the First Solar CdTe system showing the most stability.
The authors note that the systems installed in Cyprus showed a lower average measured performance ratio than those installed in Germany because of higher temperatures.
Conclusion
A couple of fairly obvious insights emerge from this article.
First, at least for the time being, crystalline technologies retain an edge over thin-film for applications where available space is an issue. Lower efficiencies in thin-film are forcing much larger system sizes, as depicted in the first table above. The urban roof-top market thus remains crystalline technologies’ domain.
However, and far more interestingly in my opinion, thin-film technologies’ relative performance stability in warm weathers, as demonstrated by lower MPP power temperature coefficients, makes them superior alternatives for areas where temperatures between seasons range from very hot to hot, and where module temperatures are likely to be fairly high year-round. In Cyprus, according to data in the study, average monthly temperatures stood near or below 15 degrees Celsius (~60 degrees Fahrenheit) during six months out of the whole year. Several potenially large markets will show much higher temperatures throughout the year.
Incidentally, such regions could become, because of their solar irradiation r
egimes, very attractive solar PV markets. Areas such as India, North Africa, the Middle East and Australia all come to mind (the scale shows kWh/m2/day).
India recently announced it would be targeting 20 GW installed by 2020, and it was reported that it would institute a production-based incentive, which generally takes the form of a production tax credit or a feed-in tariff. In regions of Southern India with very hot summers and hot winters, thin-film technologies would probably offer the best alternative for ground-mounted installations, which will likely spring up in fields across the region if the incentive is generous enough.


