J. Peter Lynch
I have been reading your articles for years and always thought your stock market related insight was interesting and helpful for me as an investor. At the current time I am worried about the market and am wondering where you think the market is currently, given the major run up we have had in the past year. I would also be curious about your view on solar stocks and what you see for them.
Claude M., France.
Claude, great questions. You are really going to make me think about this one. Sorry for the long answer but the question really got me going.
Every step of the way since April of 2009 we have heard the popular financial press and the frenetic cable pundits tell us a litany of things to worry about – foreclosures, unemployment, the growing deficit etc. and it still continues today.
However, all along this troubled path the market has steadily moved up, climbing a classic “wall of worry” with all the major averages advancing significantly from the March 2009 lows – S&P 500 +77%, Dow Jones +68% and Nasdaq + 94%.
These are very strong numbers, by any historical measure and the logical conclusion to draw is that the market must be close to a top. I certainly understand that and in fact, personally “feel” (read that as “emotion”) that this is the case. But what is important to understand is not your or my emotions or what we think “should” be, but what is. Sounds simple and obvious, but believe me, it is not.
As I stated on 3-17-2009, a few days after the market bottomed and this bull market started:
I have been a student of the market since 1975 and I can assure you that there is plenty of FEAR out there now. Nothing is 100% for sure, as we all know. But I think we are either at a significant bottom or very close to it. Everything is so “oversold” at this time, that I think the worst case is that we get a significant rally in what could still be a bear market.
Once again, sounds obvious with all the historical data available. But how many people recognized this and had the courage and discipline to jump in at that time?
Currently the market is performing in a very orderly manner and the underlying technical measurements are sound and are still pointing to a higher market with the major longer term uptrend still intact, despite all of the worries and other concerns. It is also true that the market is currently at a HIGHER relative level of risk (overbought short term) and things could change quickly. But the market has done this before – back in late 2003 and early 2004 the market stayed at a comparable high level of risk for extended periods of time climbing another classic “wall of worry.”
At this time, some additional relevant historical data is worth considering. Since the beginning of this new bull market (March 2009) the stock market has had two meaningful corrections of greater than 5% and less than 10% (June – July 2009 and January-February 2010) and no corrections more than 10%. This situation is historically a sign of a healthy unfolding stock market. A market that goes “straight” up with no corrections is a dangerous situation not a healthy situation.
As I said, the market has not had a correction of 10% or greater since March of 2009. Why is that significant? It is significant because there has never been a bull market in the last 80 years that has not had at least one 10% correction before it topped out (Credit: Invest Tech Research). As a result, it is likely (from an historical statistical point of view) that we will have at least one 10% correction and then another move upward before the end of this bull market. Historically a lot of money has been left on the table after the first 10% correction, if you sold out too soon and did not give the market a chance to run its course.
Where we are now? Somewhere toward the end of Stage 2!
I always think that a picture can tell a better story than hundreds (or thousands) of words, so take a look at the diagram below. This is a snap shot of the classic stock market pattern, how it “usually” unfolds and where I think we are now on the curve.

These stages are the four classic stages of a typical market cycle that generally moves from fear to greed and back.
Stage 1 – Capitulation: This was late 2008 and early 2009. The world as we know it is ending and all was lost. If you go back and look at the “headline hysteria” back then this would not seem far from the truth and the general consensus at the time.
Stage 2 – Doubt and Skepticism: This is the period we are in currently, climbing a wall of worry. The market has been moving up for over a year and still most people do not believe that this can be real. This psychological fact is reflected in the various measures of investor sentiment according to the American Association of Individual Investors, which are currently approaching levels that are historically seen at correction or market tops. It is a scary time, but the main trend is still intact and can remain intact for quite some time, even at these levels. But a watchful eye is necessary at this time. Risk is higher, but opportunity may still be around until we see indications of entering stage 3.
Stage 3 – Euphoria: Here is where the greed factor and fear of being left behind starts to come into play and usually after one last correction the market takes off on its last glorious run up, taking the general public with it. This always ends the same way. After this last run up there are no more buyers, the professionals are sellers and the public is left holding the bag with only hope to cling to. During this stage you will start to see very positive headlines and the pundits pointing to a bright future.
Stage 4 – Hope followed by Fear: As the market begins to roll over and start down the slopes of hope investors keeping hoping that it will come back. Despite the clearly deteriorating underlying technical factors, people just do not want to believe (i.e. emotional decision) that it is happening. They seem to think “this time it will be different.” But alas, that is very seldom, if ever, true and the hope gives way to fear and finally to capitulation when investors dump all the rest of their stock (Feb-March 2009).
My advice to you is do not lose heart. I have been an investor for over 35 years and I know all of the above perfectly. But that does not mean that I do what I say and what I know from experience. It is a constant battle and the best you can do is be aware of it, learn from it and try to develop an unemotional method to deal with it. It is an amazing 4-stage phenomenon (cycle) and the good news is that it has consistently repeated over the years and I would expect will continue to do so. If you are NOT invested now, I would not start now and I would at least wait for a pullback from current over-bought conditions.
Solar Stocks
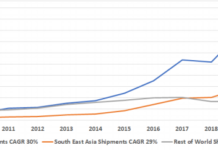
Solar stocks did great for the first 12 months of the current bull market (3/09 – 3/10) up an average of 124%. But as I mentioned in an earlier article the vast majority of that gain was centered in a 8 Chinese stocks CSIG, CSUN, JASO, LDK, SOLF, STP, TSL and YGE which were up an amazing 267.96% on average, certainly the major reason th
at the group as a whole was up 124%. Without the Chinese companies the solar group would have actually underperformed the major averages for that 12-month period.
Looking a bit deeper, more than 50% of the 267.96% gain was from 2 stocks CSIG and TSL. This is an extreme case of narrowing (2 of 21) leadership in a sector and is usually a bad sign for the sector. Also the fact that all of these leaders were Chinese companies indicates to me that the trend is clearly to lowest cost. Good for the Chinese companies, maybe not so good for U.S. and European companies.
Looking at the first quarter of 2010 the numbers reflect this narrowing with solar sector underperforming the general market significantly.
|
Solar Stock Performance First Quarter 2010 |
|
||
|
|
|
|
|
|
All Solar Stocks Average |
-9.89% |
|
|
|
|
|
|
|
|
Dow Jones |
|
+4.11% |
|
|
S&P 500 |
|
+4.87% |
|
|
NASDAQ |
|
+5.68% |
|
|
|
|
|
|
So what does this mean for the investor interested in the solar market sector?
It means that the industry is starting another transition phase in its long-term growth. This is a period of “lowest cost wins” and of industry wide profit margin compression. It means that because of these factors and probably a host of other factors (lower natural gas prices, uncertainly of government policy etc.) that the solar segment has been a lagging market sector and probably not one that is optimal at this time for new investment. Especially given the higher risk level that the general market is at now.
It also means, in my opinion, that the U.S. has to wake up and start to move forward now (instead of our usual approach of thinking about having a meeting to discuss planning to do something maybe sometime in the future when all the stars are perfectly aligned i.e. all talk and very little action of any significance) with a strategy to compete with our lower cost Chinese friends. I do not think we can beat them at their own game – lowest cost via cheap labor.
What the U.S has to do now is to do what we do best innovate. This is the time for investment and focus on new technologies and “out of the box” thinking. This is a time to increase focus, investment and activity rather than slow down and wait for someone else to do something that we have historically always been the best at doing. The ball is in our court.
Mr. Lynch has worked, for 33 years as a Wall Street security analyst, an independent security analyst an investment banker and private investor in small emerging technology companies. He has been actively involved in following developments in the renewable energy sector since 1977 and is regarded as an expert in this field. He was the contributing editor for 17 years to the Photovoltaic Insider Report, the leading publication in PV that was directed at industrial subscribers, such as major energy companies, utilities and governments around the world. He is currently a private investor and advisor to a number of companies. He can be reached via e-mail at: SOLARJPL@aol.com. Please visit his website for the promotion of solar energy – www.sunseries.net.


so now with the major environmental disaster in the GoM, I personally feel that alterative energies will start gaining some momentum. the question is which one? solar can be adopted by individuals, wind most likely by corps since it is not viable in suburbs, geo goes to even larger corps. So do you think the best play here is green ETF’s?
Solar for autos, businesses, homes is a future reality. With billions of dollars being invested a major breakthrough will happen to reduce costs in years not decades!
I invested recently in Envision Solar (evsi.bb) and am looking for more Solar investments. The appeal was the CEO was an architect and all the projects (they showed the investors) looked great. Big clients McDonals, Dell Computers, Kyocera, UCSD. I think the EV will drive solar before residential but does it matter? Solar must grow … Oil must diminish.